more about this project
Who, when, what?
Summary
In the course Programmed Design 2 (in combination with the course Programming Languages 2) we dealt with the visualization of a self-selected data set, in which it was necessary to make connections visible and to develop an interactive system between them. The aim was to use as few alphanumeric characters as possible, as long as they are not useful for navigation or explanation. Icons, symbols or similar should not be used. The developed visualization should make information visible primarily through colors, shapes and animations.
Duration
The project was created over a period of 12 weeks in the Programmed Design ll course in the 2nd semester at the Hochschule für Gestaltung Schwäbisch Gmünd.
Team
This project was created without a team.
Methods
Research, Concept, Data cleansing and structuring, Sketching,
Coding, Prototyping, Interaction Design, Animation
Tools
Pen and Paper, Miro, Figma, Adobe Dreamweaver, VS Studio Code, After Effects, JavaScript, jQuery, HTML/CSS
Live-Version
Final Product Trailer
The Goal
In the project „Killed by Police“ I dealt with the dataset „Police Shootings“ which was created in connection with the article „Fatal Force“ of the Washington Post. They recorded all fatal police shootings in the line of duty since the beginning of 2015. The dataset is quite extensive and has several parameters. Among them the name of the victim, gender, age, ethnicity, city, exactly geodata, but also whether the person was armed or unarmed. Also there are notes on mental health and whether the victim fled or the incident was recorded. In total, the dataset covers over 5 years and 6005 victims so far. It was important to me to make things visible that might be lost in the amount of data.

Concept
Color choice
The color concept is kept as reduced as possible, because a colorful color concept would not have corresponded to the serious and tragic theme. I tried to find strong and concise colors that are similar in their importance, so that they only gain other significance through their opacity or use. These colors are used alternately as accents or background colors to create a coherent overall look. A red tone with blue undertones. A very dark gray, but still not black, so as not to create too strong a contrast with the lighter gray, so that the image is still pleasant to look at. Matching this was the lighter gray, an off-white. Another accent color was formed by the strong blue, which should be assigned to the police.

Use of Forms
With the form language I tried to keep also a reduced representation and limited myself only to the circle as surface and as border, drop and rectangle in radial arrangement. Thus an overall picture could be produced, which nevertheless possesses sufficient distinctive power among themselves.
Drop shape, with the tip pointing upwards:
Here, the gender was classified as female in the dataset.
Drop shape with the tip pointing downwards:
Here the gender was classified as male in the dataset. Without a clear classification or other gender, the representation of the drop becomes a pure circle.
Circle shape:
The pure circle otherwise finds its application in the map representation, with the droplets transforming into it when switched.
Circles and drops as pure borders and without filling:
This form of representation is used with the „Escape“ parameter. If the areas are filled, no escape took place, but if the victim wanted to escape, the drops and circles are displayed as borders.

Prototype
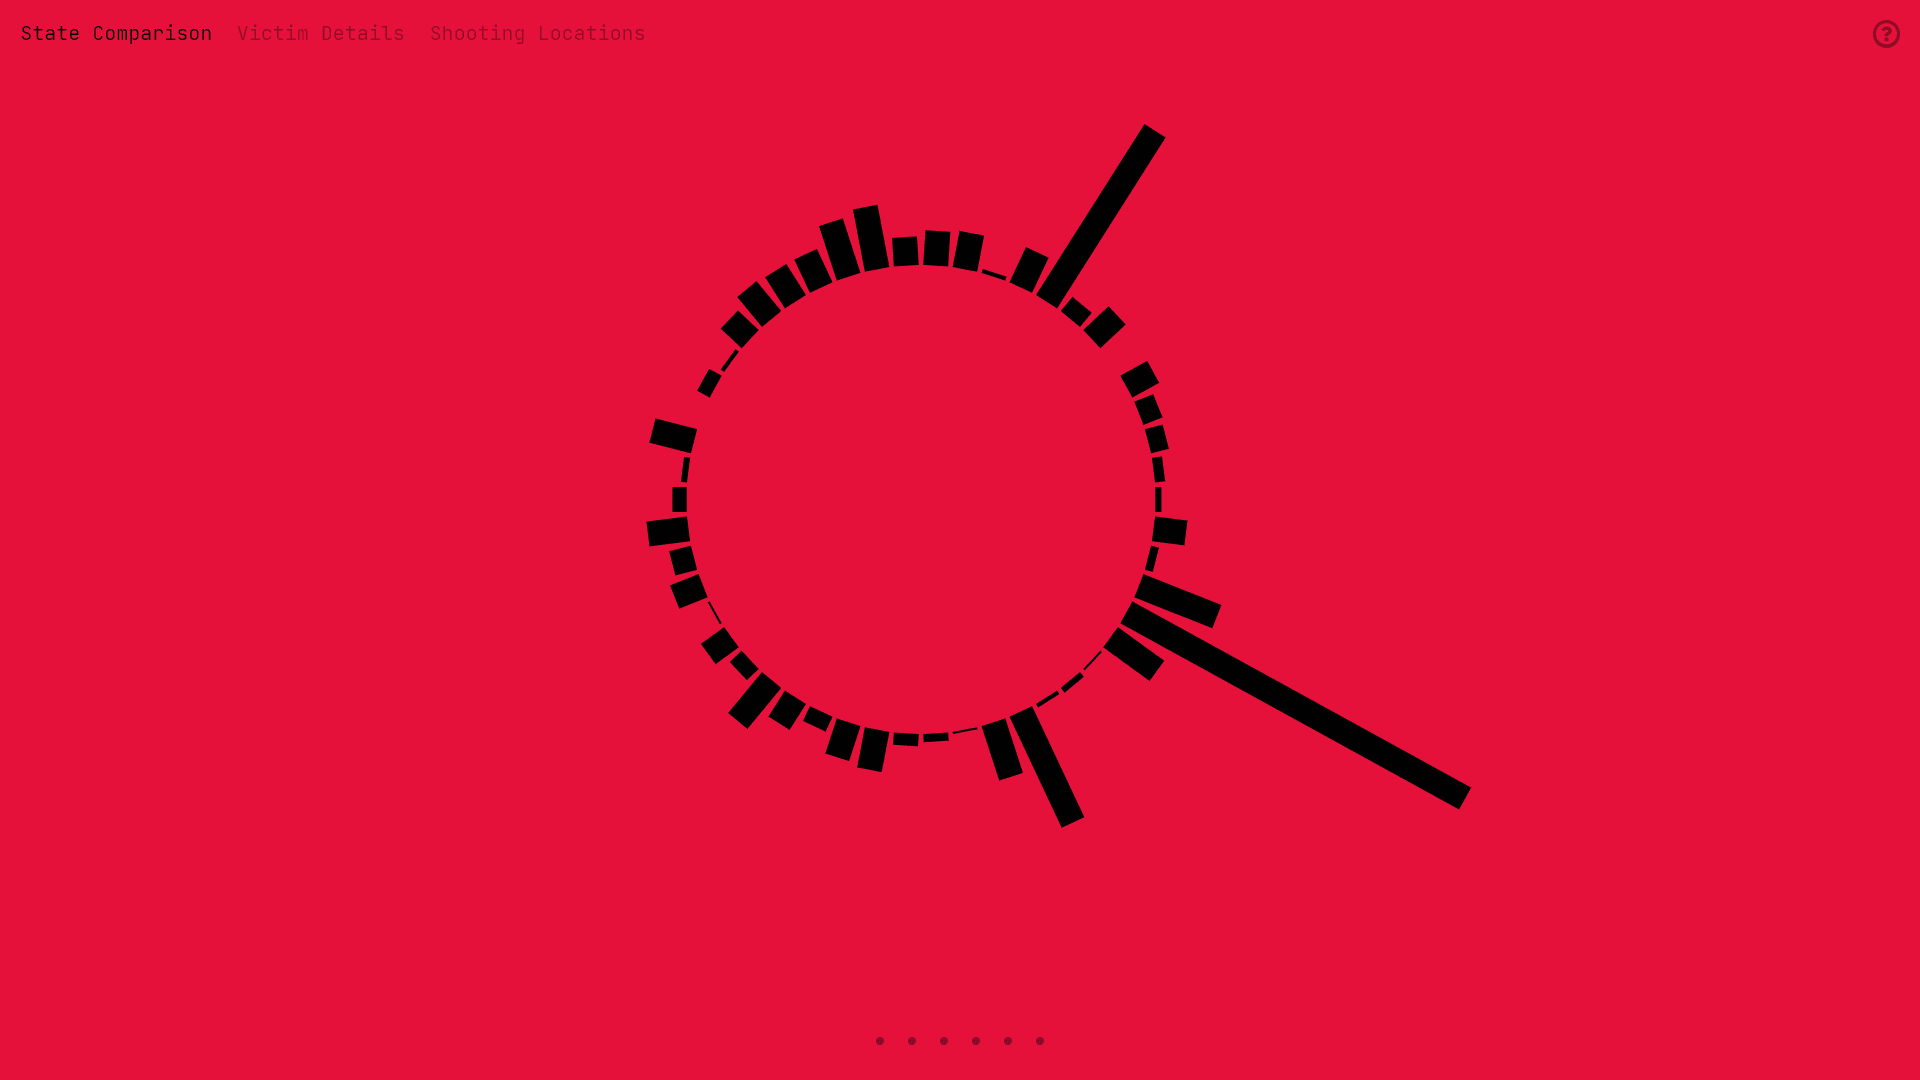
State Comparison
The first illustration shows an overview of the states and their numbers of victims who died as a result of police violence. The states are arranged radially as bars in order to maintain the circle as the dominant design language. If you hover over a bar, a tooltip appears that reveals the exact number. In the timeline you can choose to display the different years.

Victim Details
The second display shows the details of the victims, here several parameters are visualized to get an overview in the amount of data, e.g. how many people fled, how many of them had mental illnesses and how old these people were. It creates visible correlations that were lost in the sheer mass of the dataset. Each tooltip also displays the name of the victim so that they do not remain faceless but also have a relation to the visualization.


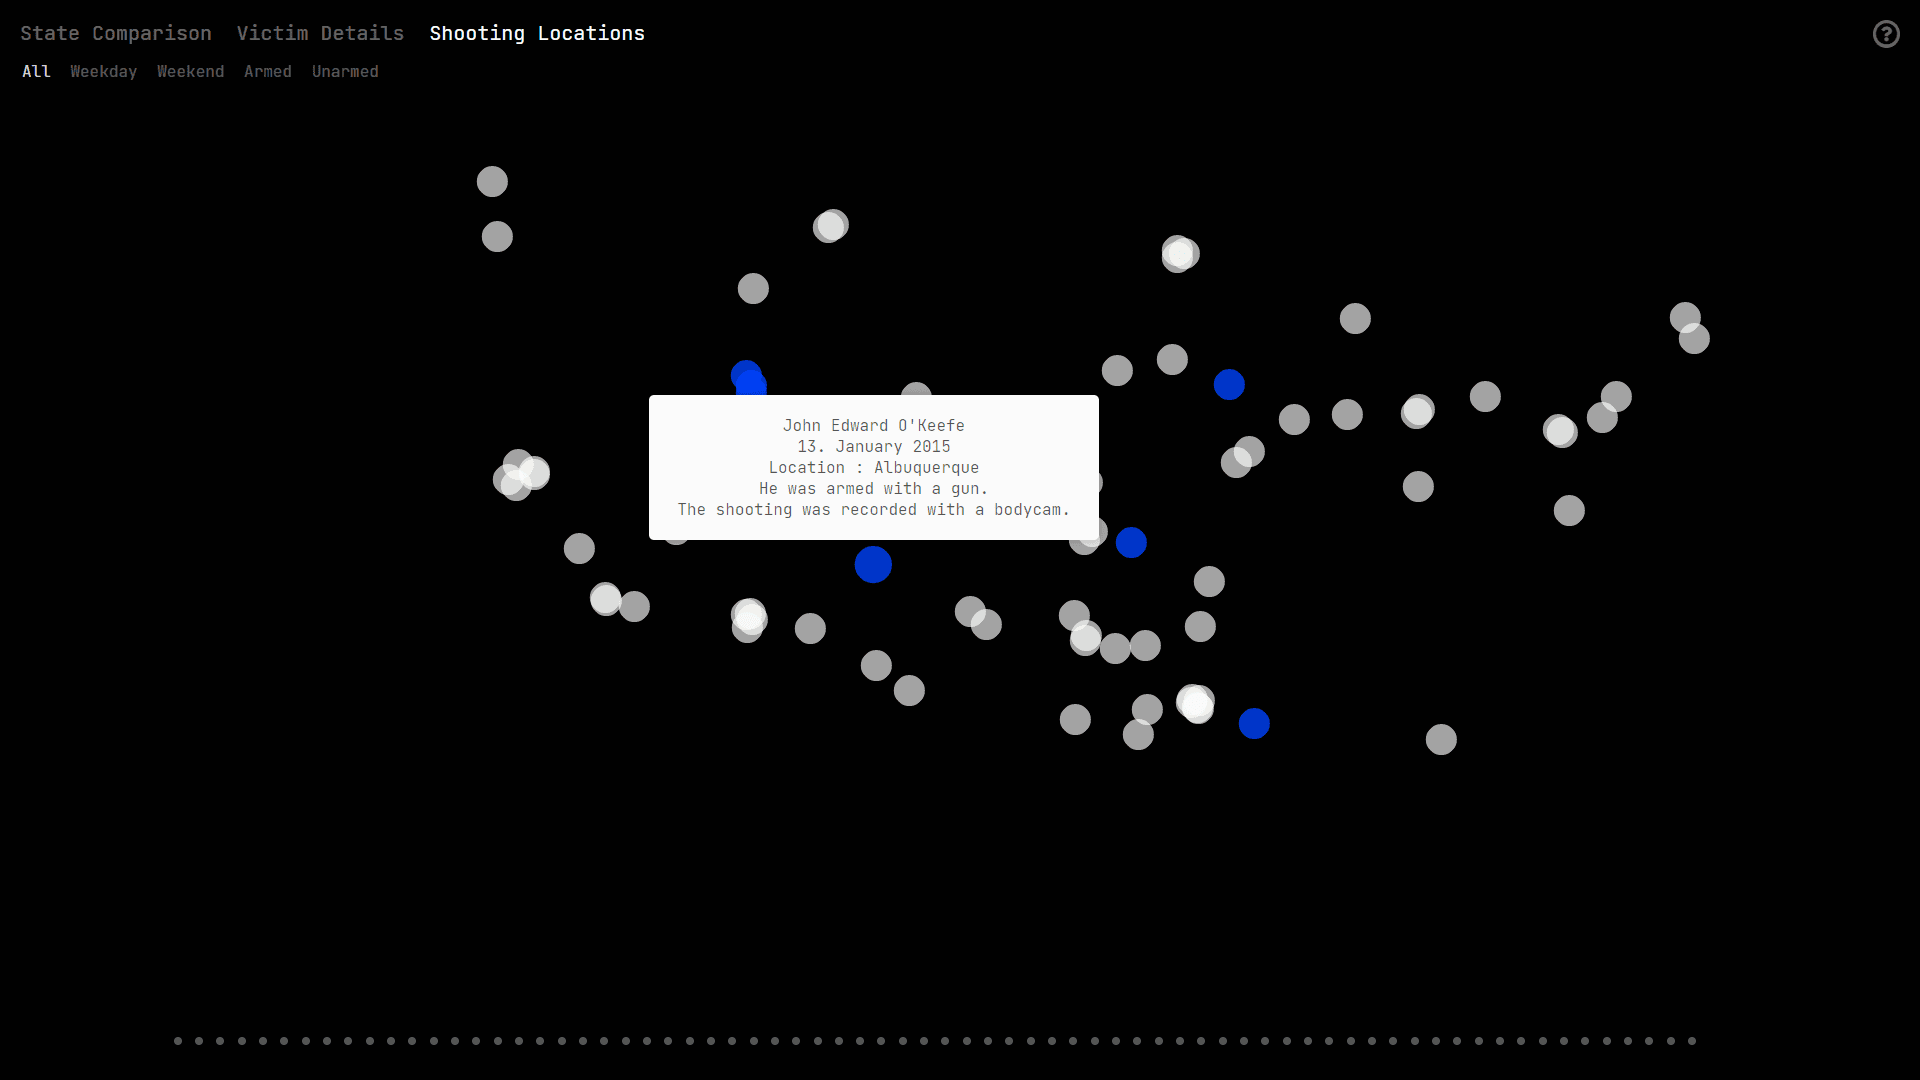
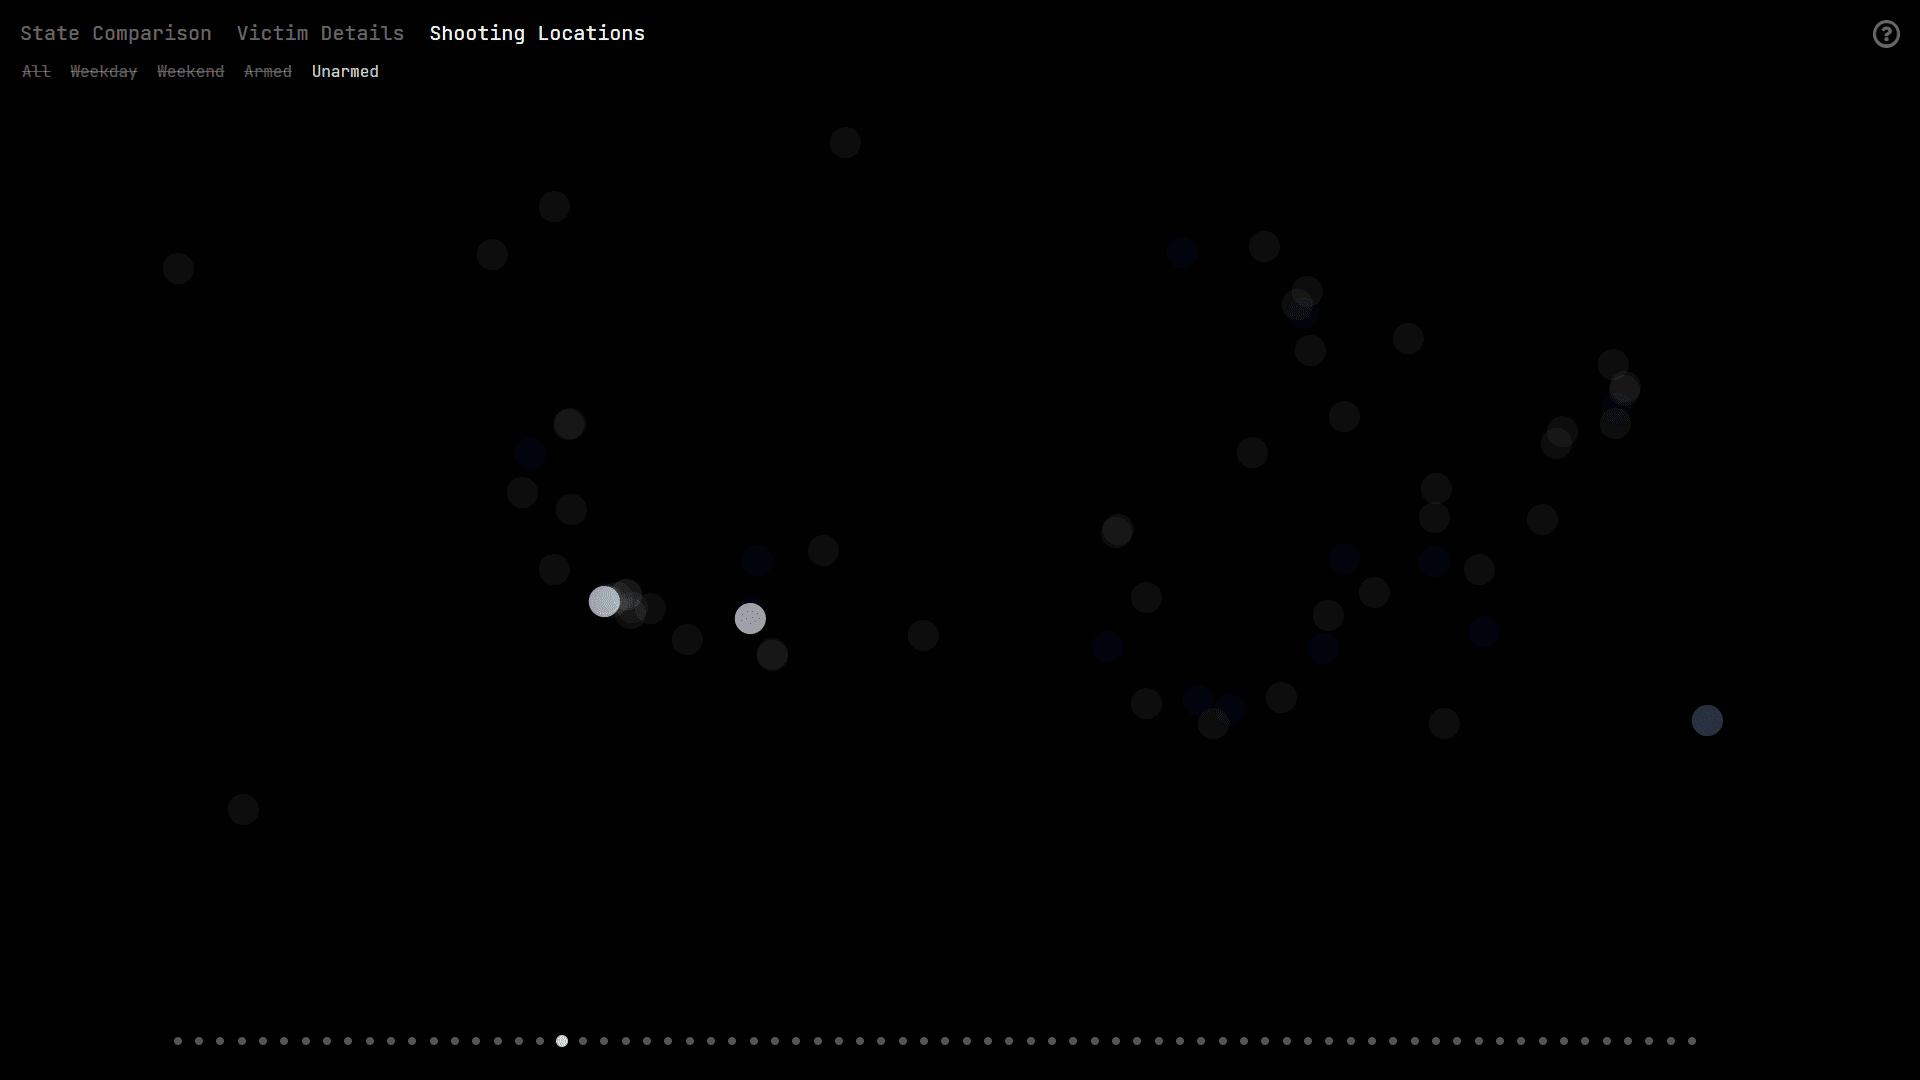
Shooting Locations
The last display is dynamically generated from the Victim Details display by mapping the position via Longitude and Latitude parameters. Here I wanted to make one thing visible, if there are hotspots for such cases and if they are recorded by the bodycam of the police officer. Shockingly, only a fraction are actually recorded. In addition, the items can be filtered by day of the week and weekend to provide context to the time. You can also see whether the victims were armed (and if so, with what) or not. The tooltip reveals the weapon, the place, the time, again the name and whether the case was recorded.